Why we consistently underestimate the renewable energy industry: Accelerating our green future.
January 7, 2023 by Charles
Renewable Energy
Over my 15+ year career in the energy industry, I have noticed one very peculiar issue.
We (as an industry) have consistently underestimated the rate of progress within the renewable energy sector. From the ability to forecast the size of new wind turbines to predicting the price outcomes and winners of renewable energy auctions.
Every time the industry witnesses a new low PPA price, there are cries of “it’s not possible”, but time and time again these people are proven wrong and the projects get built.
Why is it that even industry insiders cannot accurately forecast where the technology and market are going?
In this article, I will look into a fascinating paper which explains this phenomenon and provides a new model to better forecast the future of the renewable energy industry.
Empirically grounded technology forecasts and the energy transition by Rupert Way, Matthew C. Ives, Penny Mealy, J. Doyne Farmer
Spoiler alert.. the future is going to be greener and cheaper than we think.
Exponentially improving technology
The paper explains that the underlying reason we underestimate the potential of renewable energy is that these technologies are following exponentially decreasing costs and exponentially increasing deployment.
Humans are terrible at visualising exponential growth. Simply our brains are not wired to think this way.
There is an excellent example of this, which was first recorded in 1256. If you take one grain of rice on the first square of a chess board and then double the amount on the next, 1, 2, 4… the amount increases exponentially such that on the 64th (last) square, there would be over 18 quintillion grains of rice on the board.

Failure to forecast
If we take a look at historically published industry forecasts we can see this continuous underestimation. Note that the y-axis on these charts are a log scale which hides the massive amount by which the forecasts were wrong.
The mean value of the historially projected cost reductions was 2.6%, and all were less than 6%. In stark contrast, during this period, solar PV costs actually fell by 15% per year.
Empirically grounded technology forecasts and the energy transition

(B) PV system floor costs implemented in a wide range of IAMs. Observed PV system costs are also shown.
For several decades the costs of solar photovoltaics (PV), wind, and batteries have dropped (roughly) exponentially. The cost of solar PV has decreased by more than three orders of magnitude since its first commercial use in 1958
Empirically grounded technology forecasts and the energy transition
What the renewable energy industry has done over the last 20 years is truly remarkable. I for one am very proud to have played a part in this energy transition, and I know many of my colleagues feel the same.
A better way to forecast technology costs
The paper separates energy technologies into two categories, flat and exponential, based on the rates of improvement. Depending on their categorisation they use two different methods of forecasting future cost and deployment.
Flat
The first group, are those technologies which after adjusting for inflation, have flat costs over extended periods of time. Fossil fuels are the primary example of this. Effectively the technology improvements are used to keep pace with the increased cost of extraction as the resources get depleted. This is a phenomenon which has been constant for more than 100 years.
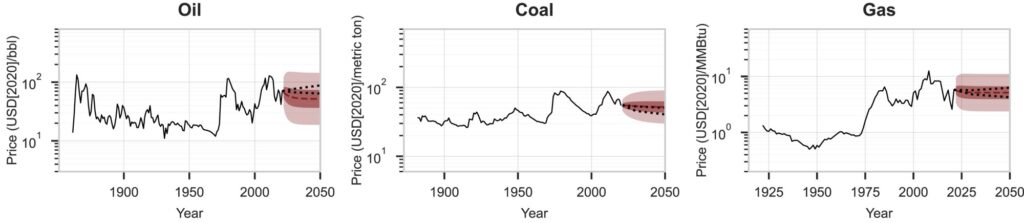
This flat cost evolution is true of all minerals and interestingly is also true for carbon capture and storage (CCS) which even after significant political and financial support has failed to improve in cost over its 50-year history.
On a short timescale, market trading leads to a random walk in the cost evolution but over longer time scales the costs mean revert. Due to this fact, the authors can then use autoregressive probability modelling for the “flat” technologies.
Exponential
The second group of technologies follow an S-curve, whereby they have a long period of exponential growth which eventually plateaus once the market gets saturated.
A well-known example of this is electrical transistors which have improved by 40-50% per year. Solar PV, wind and batteries are similar but experienced a more moderate 10% per year improvement rate. These technologies can be modelled by Moore’s law, which shows cost dropping by a fixed percentage per year (made famous for forecasting transistor improvements). Alternatively, they can be modelled by Wright’s law which predicts cost to fall as a function of cumulative production. This is also known as the learning curve or experience curve.
This paper uses Wright’s law as it is more intuitive for the industry although Moore’s law produces significantly similar outcomes. Using these laws the researchers are able to produce future values of cost and deployment with a high 95% confidence interval for solar PV, wind and batteries.
What about Hydrogen?
The fourth exponential technology discussed in the paper is green hydrogen. This is also modelled using Wright’s law but the forecast is much less accurate as this technology is relatively new and not yet deployed at scale. The model shows significant cost improvement and market growth but the final outcome is less certain.
Currently 60% of the cost of green hydrogen comes from the cost of the input electricity, and 80% of the cost of ammonia comes from the input hydrogen. Green P2X technology will therefore automatically benefit from the exponential cost improvements of both Solar PV and Wind.
What does this mean for the future?
The paper takes the modelling above and generates three future scenarios.
- Fast Transition, where fossil fuel use stops in 2050
- Slow Transition, where fossil fuel use stops in 2070
- No Transition, where fossil fuels continue to dominate the energy mix.
Looking below at the three scenarios, we can see that in both the Slow and Fast transitions there will be a rapid growth in the deployment of both wind and solar PV. Furthermore both cases show the rise of P2X fuels as a meaningful part of the energy mix by 2040.
I was surprised to see that nuclear in the best case remains constant but under a fast transition away from fossil fuels, it tends to zero. The authors explain that this is due to the fact that there is no path today to technology improvements which bring the cost into line with renewable technologies with batteries and P2X. They constructed a scenario where nuclear becomes dominant but it ended up being ~25 Trillion$ more expensive than the No Transition case.
Focussing on electricity generation we also see a very rapid increase in battery storage and electricity used for P2X. If you recall, Wright’s Law describes how costs fall as technologies are deployed. This means that in the Fast Transition not only will we see rapid deployment but the cost will fall faster in doing so, a win-win.
Conclusion
The final conclusion of this paper is extremely positive.
If the world was to commit to “getting off” fossil fuels by 2050 the Fast Transition described in the paper would lead to an annual energy system cost more than 500B$ cheaper than the No Transition scenario.
The Fast Transition is also cheaper than the Slow Transition because it allows the world to access lower-cost energy sources faster. It would also further accelerate the probability of rapid technological progress.
In this electrify everything world we would also see a dramatic decrease in CO2 emissions which would enable the world to meet the 1.5° Paris Agreement target.

We want to emphasize that our results indicate that a rapid green energy transition is likely to be beneficial, even if climate change were not a problem. When climate change is taken into account, the benefits of the Fast Transition become overwhelming.
Empirically grounded technology forecasts and the energy transition
If you have not already done so, I highly recommend you go and read this paper on their site and share the findings. Most of the general public believes that a green energy transition would be more expensive and in some cases impossible to achieve. This paper shows that the opposite is true. I was very positively surprised with the outcomes and some myths which I believed have been dispelled. This paper gives me even more personal commitment to supporting the renewable energy industry to help get the world off fossil fuels.
If you like this article then please provide your thoughts and comments below. To be notified about future articles you can join my monthly newsletter and follow me on Linkedin and Twitter.
Precisely the same result as out Modelling team led by prof Christian Breyr @UNILUT has modelled.